There is a new open social ecosystem emerging around the AT Protocol, also known as atproto. Perhaps youʼve never heard of it, but you should check it out. Itʼs tech with an ethos.
The open atproto system provides a social graph of more than 40 million Bluesky users.
Building on this protocol, you can make your project everyoneʼs new favorite social network.
Interoperable alternatives to Bluesky, such as Northsky, Eurosky and Blacksky, managed to attract user groups by addressing their specific needs.
They all are built on the software components that Bluesky provides.
We will get an overview of those components and find out which problems arise when your userbase grows.
The Bluesky AppView
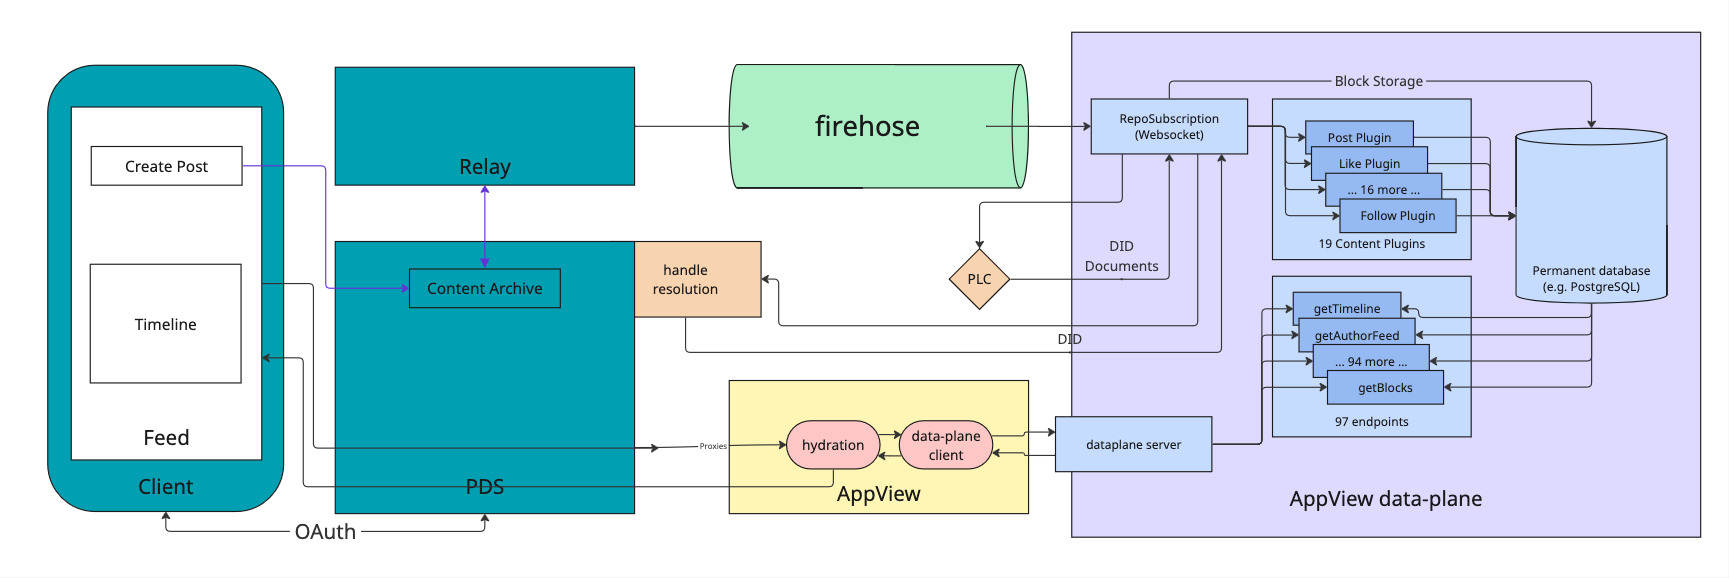
The diagram below shows an architectural overview of Bluesky with the three main infrastructure components involved.
Personal Data Server (PDS): every user has their own, this is where all their data is stored.Relay: polls every existingPDSon the network to collect changes and emit them in a single event stream called theFirehose.AppView: essentially is a regular app backend which receives events from theFirehose, processes them and makes data available via an API. The actual data storage is abstracted in adataplanecomponent.
For a write event, such as Create Post, a record is stored in the Content Archive inside the PDS of the user.
It is then emitted via the Relay into the Firehose.
The dataplane of the AppView subscribes to the Firehose to receive the event and indexes it into a permanent database.
To read their Timeline, a user performs a request which is proxied via their PDS to the AppView, which in turn retrieves the data from the dataplane and returns the timeline to the user.
All of the components displayed are available as open source software. Bluesky itself runs almost entirely on these open source components.
There is one notable exception: the dataplane, the part of the stack that processes the event stream of the atproto firehose and does the most heavy lifting. While it is available as open source, this dataplane implementation is not very performant. Bluesky uses a closed source dataplane implementation in production for this reason.
The open source dataplane functions on a fan-in principle:
- events are streamed into the system (e.g. “new post”)
- the dataplane stores and indexes the events in ordinary Postgres tables
- on user request, data is queried and presented to the user (fan-in)
The Problems of the Dataplane
The fan-in approach works well as long as the number of users is small enough.
At some point, often with less than 100_000 users, the user experience degrades and the server runs into issues.
<--- Last few GCs --->

[55267:0x7bd40c000] 12985916 ms: Mark-Compact 4016.0 (4165.4) -> 3962.5 (4175.4) MB, pooled: 0.0 MB, 1065.65 / 0.00 ms (average mu = 0.156, current mu = 0.074) allocation failure; scavenge might not succeed
[55267:0x7bd40c000] 12987076 ms: Mark-Compact 4026.5 (4207.4) -> 3973.1 (4217.9) MB, pooled: 0.0 MB, 1078.12 / 0.00 ms (average mu = 0.116, current mu = 0.071) allocation failure; scavenge might not succeed

FATAL ERROR: Ineffective mark-compacts near heap limit Allocation failed - JavaScript heap out of memory
This episode of the pragmatic engineer newsletter lists a number of issues with Blueskyʼs Postgres-based dataplane.
- Connection pool issues and lock contention. The Postgres connection pool backup and Nodeʼs event loop got into a bad feedback loop. The team observed Postgres lock contention issues. This refers to multiple processes trying to access the same data simultaneously, but the data is locked to all except one process. For example, when multiple processes attempt to update the same row.
- Small Postgres outages. Postgres doesnʼt give the developer much control over which query plan it will take. Bluesky had a few smaller outages due to a query plan randomly flipping to something that ran about 1,000x times slower.
- The need for horizontal scaling. Horizontal scaling is adding more machines to a service, so that the throughput of this system improves linearly with each new machine. But Postgres does not support horizontal scaling because it runs as a single database with transactional guarantees, meaning it becomes a bottleneck – if a necessary one – for the entire network.
The bottom line is: the open source dataplane implementation is not optimized at all.
It exists solely to be able to say thereʼs at least one open source implementation available.
A performant open source dataplane
The real trick to solve these problems is to change the approach. Instead of querying the data on user request, we prepare data in a dedicated place for each user on write (fan-out). When the user makes a request, the data is already sitting there waiting to be served to the user.
This is the also the approach followed by the Bluesky closed source dataplane which builds on ScyllaDB. From all publicly available information, that closed source dataplane seems very optimized to their hardware, and pretty expensive to run.
We followed the same approach for our proof of concept of a dataplane, which supports indexing post and follow events, as well as serving timelines to users.
As we wrote this dataplane in Elixir (our language of choice), we used ETS, the built-in storage of the Erlang VM, instead of ScyllaDB.
ETS provides us with tables that can store tuples of data.
In the snippet below, you can see the insert_post function which indexes posts that arrive in the dataplane.
First, we record the post in the global @posts_table.
Then we lookup all the followers of the user in the @followers_table and finally store the post in the feed of each each follower, in the @feeds_table.
def insert_post(post_id, author_id) do
  :ets.insert(@posts_table, {post_id, author_id})

  follower_entries = :ets.lookup(@followers_table, author_id)

  Enum.each(follower_entries, fn {_subject, follower_id} ->
    :ets.insert(@feeds_table, {follower_id, post_id})
  end)
end
The read operation to get a timeline for a user is then a single lookup in the @feeds_table.
def get_timeline(user_id) do
  @feeds_table
  |> :ets.lookup(user_id)
  |> Enum.map(&elem(&1, 1))
end
Our ETS dataplane not only shows a significant performance improvement over the available open source implementation, it also has no operational overhead — ETS is built into the Erlang VM. So we run a single node with our Elixir application and thatʼs it.
As a bonus, we get all the benefits of running Elixir:
- good resource utilization and error isolation just come naturally with the parallelism provided by the Erlang VM
- tooling for introspection and observability is available out of the box
- in case of traffic spikes, the runtime will bend instead of breaking, and continue to serve the users
- no big refactor needed if we ever want to distribute the load over multiple nodes or start sharding the data
Our big goal here is that we build a dataplane that is low-effort to operate and runs on commodity hardware, but scales way better than Blueskyʼs open source dataplane.
A peek into performance
As we want to focus solely on the characteristics of the storage technology and basic approach (fan-in vs. fan-out), we created two versions of the dataplane in Elixir:
- the proof of concept we already talked about which follows the fan-out approach and stores data in ETS
- a copy which differs only in following the fan-in approach and storing data in Postgres (and is therefore representative of Bluesky's open source dataplane)
With that, we could evaluate the proof of concept by measuring direct reads and writes to the dataplanes, bypassing all other factors that play a role in a real-world scenario.
We simulated write traffic and let a number of users make requests to load their timeline (get_timeline).
In the dashboards below, you can see the number of simultaneously active users (“Active Sessions”), the write traffic (“Posts created”), and the latencies and throughput of get_timeline requests.
Under heavy load, the Postgres backed fan-in implementation showed significantly higher latencies and lower throughput in comparison to the ETS backed fan-out implementation.
Advanced simulations
We extended this proof of concept into a performance toolkit you can use to simulate traffic via atproto events and user requests.
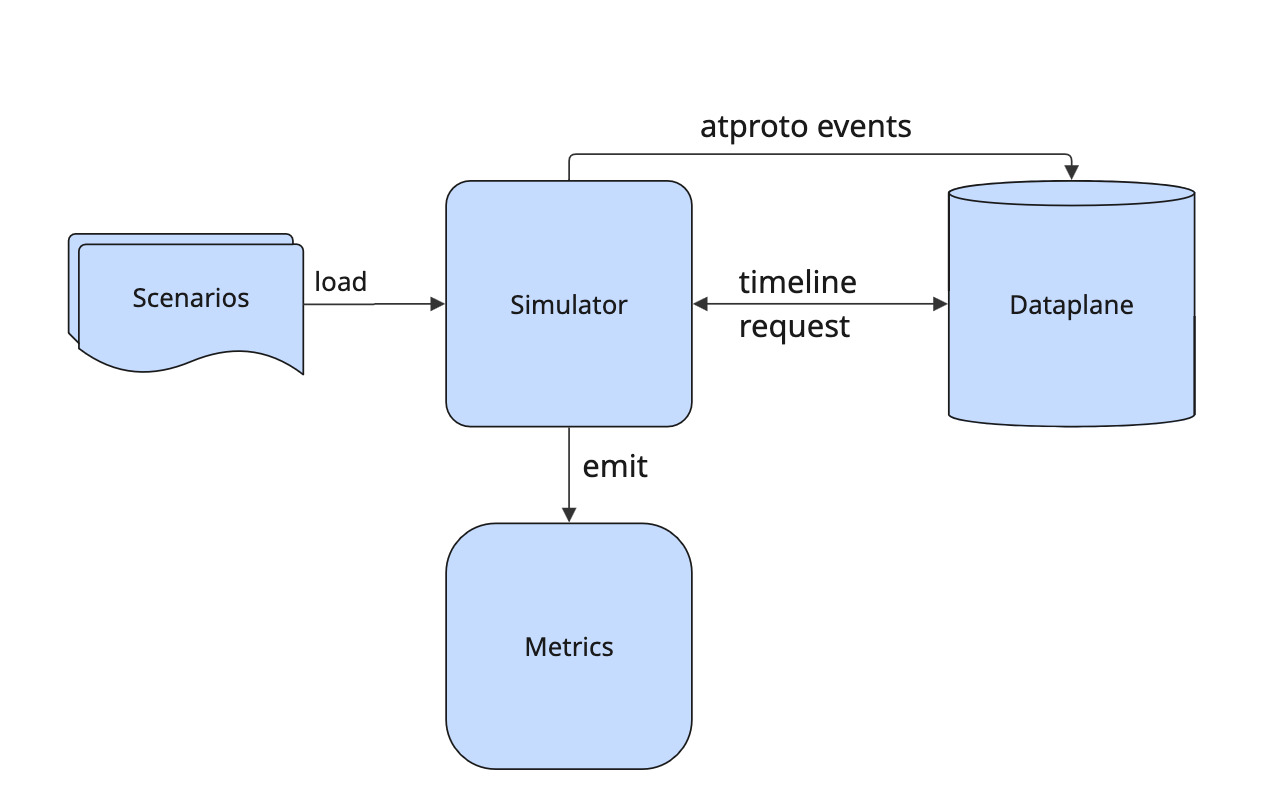
As a fundamental principle, we want to be able to repeatedly simulate scenarios. Therefore, you provide the configuration for a scenario as a file that you can load into the system.
Userbase parameters
It makes a difference for your appʼs performance whether you already have millions of users or posts in your database or none. With the performance toolkit, you can quickly create base data to prepare your application instance for the simulated scenario.
Generate users in by passing in parameters in JSON format:
{
  "name": "my userbase",
  "num_users": 100000,
  "follower_density": 5.0
}
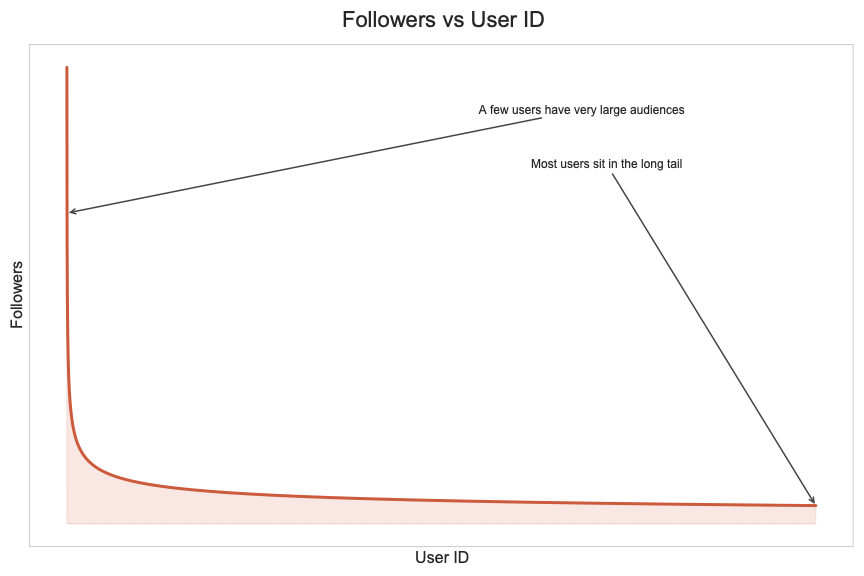
A power-law follower graph
We assign the generated users sequential IDs, and they follow each other according to a power law.
All users follow the very first user account. With increasing user ID, the number of followers gets smaller quickly.
We do this for two reasons:
- this distribution represents a realistic userbase where you have few accounts with many followers (looking at you @bsky.app) and many accounts with very few followers.
- a predefined distribution makes it trivial to pick suitable accounts for the traffic you want to simulate, as you can determine the number of followers from the user ID. You donʼt have to first search a suitable account — to simulate a post from a user with many followers, pick a small user ID.
Simulating traffic
To simulate traffic, we introduce two concepts: scenario and simulation plan. With these concepts we can represent repeatable and realistic simulations.
Scenario
A scenario captures a series of user actions that will happen at defined time offsets during simulation.
At the moment three actions can be simulated:
- user creates a post
- user follows another user
- user requests their timeline
A single scenario can contain series for all three actions, but all of them are optional.
As you can see, these actions are associated with specific users and an offset. For instance, “user 1 posts at offset 1000ms” or “user 2 follows user 3 at offset 1500ms”. This series of events gives us a repeatable scenario.
You donʼt have to write the full scenario yourself, the toolkit lets you generate a scenario from parameters, similar to what we saw for the userbase.
Here is an example for posts: we have 100_000 users in the system but only the first 10_000 will post.
We classify the users into tiers to make their behavior more realistic.
Users with many followers will post more.
{
  "n": 100000,
  "max_active_user_id": 10000,
  "seed": 43,
  "time_units": 1,
  "tiers": [
    { "max_followers": 10, "posts_per_day": 0.2 },
    { "max_followers": 100, "posts_per_day": 1.0 },
    { "max_followers": 1000, "posts_per_day": 3.0 }
  ]
}
This will result in a list of post events like the following.
"posts":
  [
    {"user_id":124, "offset_ms":719},
    {"user_id":5037, "offset_ms":4160},
    {"user_id":6504, "offset_ms":21584},
    {"user_id":7422, "offset_ms":23714},
    {"user_id":1611, "offset_ms":27590},
    ...
  ]
The simulation will then emit a realistic corresponding atproto event at the given offset into the firehose.
For usersʼ requests, such as the get_timeline request in our simulator, you can use a similar set of parameters to define the user sessions.
{
  "n": 100000,
  "max_active_user_id": 10000,
  "seed": 42,
  "time_units": 1,
  "tiers": [
    { "max_followers": 10, "session_minutes": 10 },
    { "max_followers": 100, "session_minutes": 30 },
    { "max_followers": 1000, "session_minutes": 60 }
  ]
}
With the following resulting sessions.
"sessions":
  [
    {"user_id":4684, "duration_ms":1800000, "offset_ms":9638},
    {"user_id":8021, "duration_ms":1800000, "offset_ms":17306},
    {"user_id":567, "duration_ms":3600000, "offset_ms":19438},
    ...
  ]
Each user will start a session at the corresponding offset and will perform requests to get their timeline in fixed intervals for the whole session duration.
Scenarios are intended to represent typical real world traffic, for instance a regular “saturday morning”, or you know, a “shitstorm”.
Simulation Plan
A simulation plan contains multiple scenarios that start at defined time offsets.
Example:
simulation_plan = [
  %{scenario_name: "saturday morning", path: "saturday_morning.json", offset_ms: 0},
  %{scenario_name: "shitstorm", path: "shitstorm.json", offset_ms: 100_000}
]
In this example simulation plan, the simulator starts with traffic as defined in the “saturday morning” scenario.
At the offset of 100_000 ms, it will additionally start simulating the traffic as defined in the “shitstorm” scenario.
Every simulation run follows a single simulation plan.
Repeatable Simulations
As stated before, providing repeatable simulations is a primary goal of our simulator, but we still want to enable interactive use for experimentation. If you add scenarios interactively to the running simulation, they will be included in the current simulation plan at the offset corresponding to the current runtime. That simulation plan will then automatically be exported.
So after noticing issues during experimentation, you will always have a simulation plan that you can run again to confirm the issues you noticed are real.
Measuring performance
Based on the simulated traffic, we can measure the performance users would experience.
The performance toolkit includes a Docker Compose setup for Prometheus and Grafana, with a preconfigured Grafana dashboard.
The key question weʼre interested in is how long it would take under the simulated load for a user to receive their timeline.
The dashboard shows the p99, p95, p50 latencies so we can assess this.
To gain insights into the running simulation, we also show how many user requests are performed per second and how many user sessions are active.
Furthermore, we show how many post and follow events are created, dispatched, and dropped.
The outcomes
With our performance toolkit, we ran simulations with up to 40 million users, the actual scale of Bluesky.
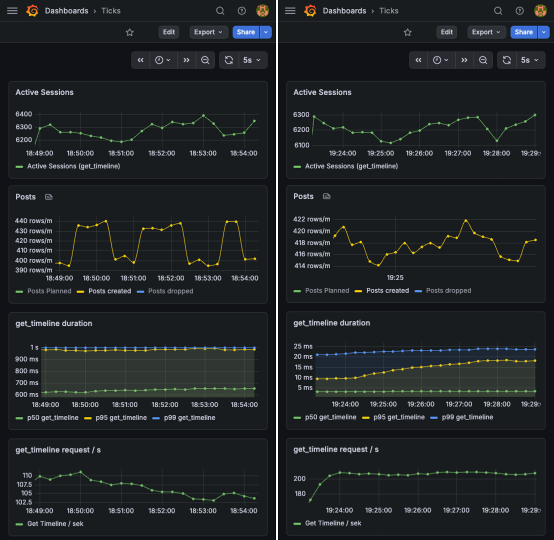
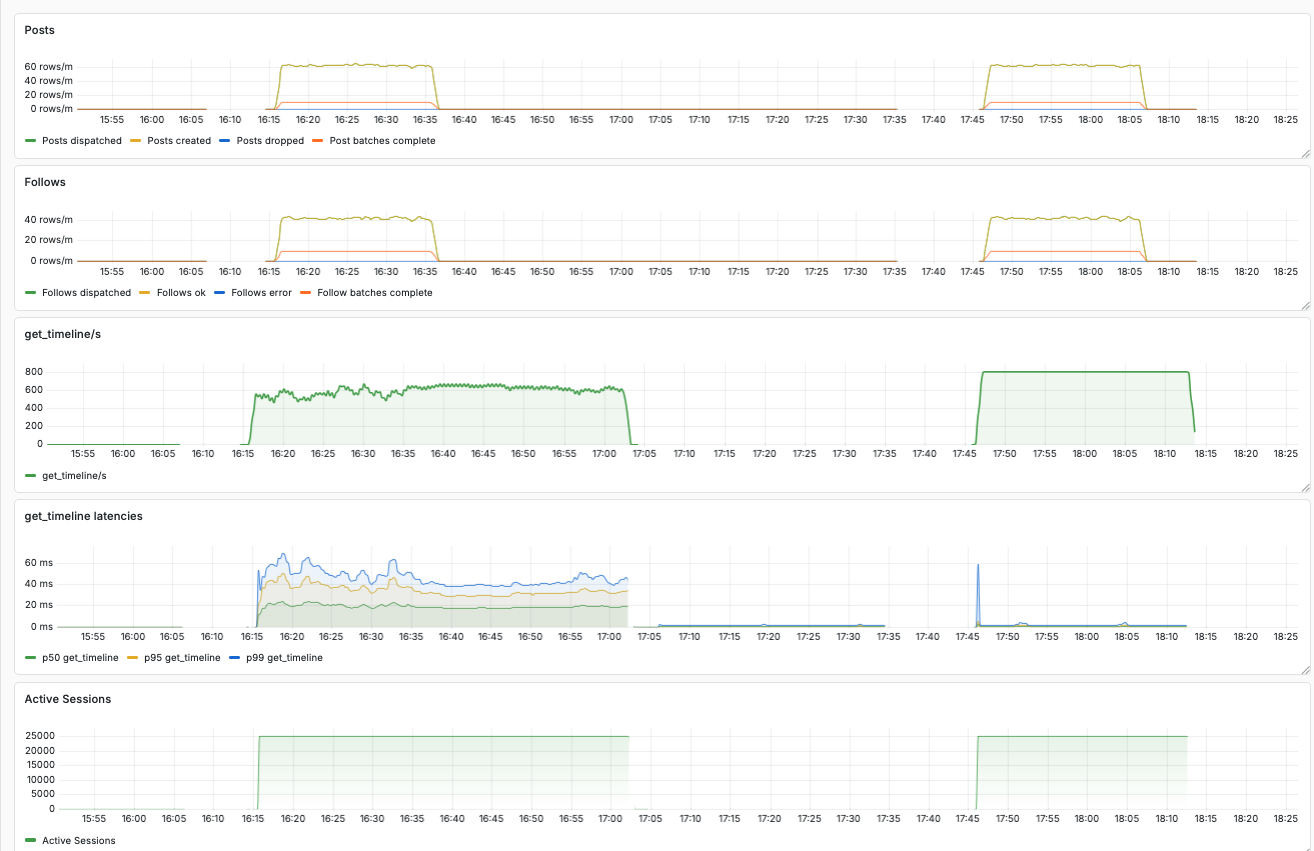
The dashboard below shows a comparison between the open source dataplane and our ETS-based proof of concept.
In this case, we ran a simulation with 4 million users, which caused around 800 get_timeline requests per second, as well as some traffic for created posts and follows.
In the screenshot of the dashboard we can see two blocks of data.
The first run was recorded with the open source dataplane implementation.
We can see a maximum p99 latency of more than 60 ms.
Furthermore, we see the throughput of requests per second fluctuating around 600.
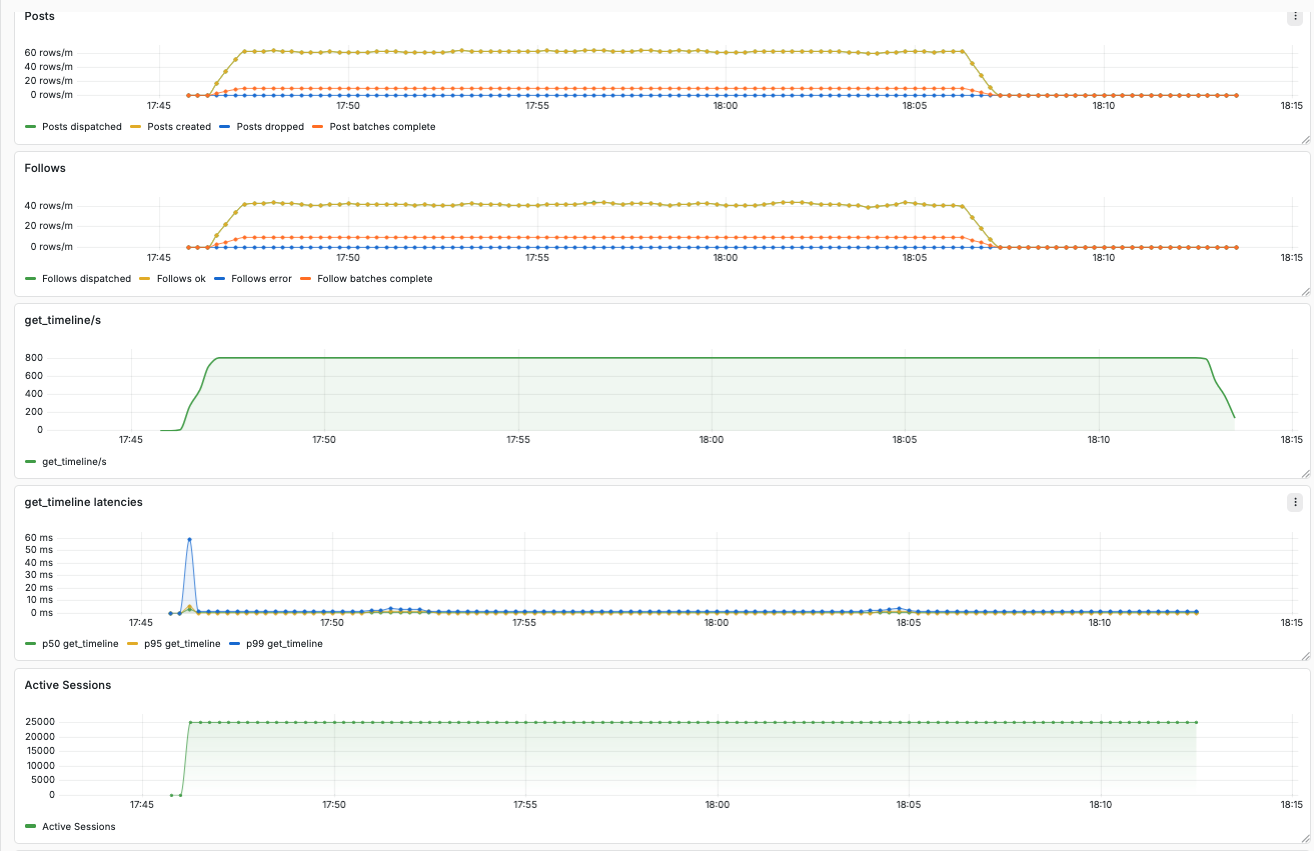
In comparison, the block on the right shows recordings of the same simulation with our ETS-based dataplane. The latencies are tiny, and the throughput sits smoothly at 800 requests per second.
Here a zoomed in view on the results for the ETS-based dataplane.
Next steps
Our big goal is an open source dataplane implementation that requires little effort to operate and scales better than the existing one. For now, our proof of concept only indexes posts and follows, but there are many more relevant event types. For comparison, Blueskyʼs dataplane implementation has 14 indexer plugins to cover all of them.
Furthermore, our proof of concept only supports a single endpoint for users to request their timeline. To complete the implementation, many more endpoints must be implemented — Blueskyʼs implementation has 96 endpoints, supporting all the features youʼd expect, including moderation and search. However, most of the endpoints are straightforward.
Lastly, we can still optimize the ETS-based implementation in many ways. And if we ever hit a performance issue, ETS as storage technology can be supported by or even completely replaced with other natively implemented datastructures, while we can retain the Elixir implementation of the dataplane server.

